Outbound SDR metrics: phone, email and sequence benchmarks
Activity turns into meetings through a chain of conversion rates. Those rates differ by channel. Take two reps. One makes 60 dials a day with a 5% connect rate. The other makes 30 with a 13% connect rate. The dashboard says the first works harder. The second reaches more people. This guide sets out the outbound metrics to track for each channel. It shows what recent public data says good looks like. Then it turns the rates into an activity plan.
SDR (sales development representative) and BDR (business development representative) are the same job at most companies. Everything here applies to both.
Only need pay and outreach? The SDR Toolkit is £12.99 + VAT.Get the playbook
The outbound funnel, channel by channel
Every outbound channel has the same shape: an attempt, a response, a conversation, a meeting. Only the metric names differ.
| Channel | Volume metric | Response metric | Conversion metric |
|---|---|---|---|
| Phone | Dials | Connect rate per dial, and per prospect | Conversations that become meetings |
| Prospects enrolled in a sequence | Reply rate, and positive reply rate | Positive replies that become meetings | |
| Social (LinkedIn and similar) | Connection requests and messages | Acceptance and reply rate | Replies that become meetings |
| All channels | Touches per prospect | Prospects reached at least once | Meetings held and accepted |
Track the response and conversion rates weekly, as well as volume. Volume tells you the work happened. Rates tell you whether it worked.
Phone benchmarks
| Metric | Benchmark | Source |
|---|---|---|
| Connect rate per dial | 5.4% average, 13.3% top quartile | Gong Labs, 2024 (300M+ calls) |
| Connect rate per dial | 9.9% | Belkins, 2025 data (175,000+ dials, published June 2026) |
| Prospects reached at least once over several attempts | 24.5% | Belkins, 2025 data |
| Conversations that book a meeting | 4.6% average, 16.7% top quartile | Gong Labs, 2024 |
| Dials per booked meeting | About 370 | Belkins, 2025 data |
Look at the gap between average and top quartile. An average rep on Gong's 2024 rates needs about 400 dials per meeting (5.4% times 4.6%). A top-quartile rep needs about 45 (13.3% times 16.7%). That is our calculation from Gong's published rates. Our reading is that data quality, call timing and the opener drive that difference.
Belkins also found an average of three dial attempts per prospect. The 3pm to 4pm window was the most consistent daily peak. Wednesday was the best day for positive outcomes. Treat these as starting points to test.
Email benchmarks
Cold email benchmarks vary widely, mostly because sources count replies differently. Some include out-of-office and automated replies. Others leave them out.
| Metric | Benchmark | Source |
|---|---|---|
| Median reply rate | 2.1%, down from 4.7% in 2022 | Visionary Marketing, April 2026 (28,400 leads, 47 B2B programmes) |
| Median meeting-booked rate | 0.34% | Visionary Marketing, April 2026 |
| Average response rate | 3.43% | Woodpecker data, cited by lemlist, 2026 |
| Best-performing sequence length | 5 steps over 14 to 21 days | Visionary Marketing, April 2026 |
Our reading: count only human replies and track positive replies separately. Compare your team with its own history. Vendor headlines count replies their own way. A sequence that books meetings from 1 in 300 prospects is normal for cold email. A sequence that books none from 600 needs a new list or a new message. Fix those before you send more.
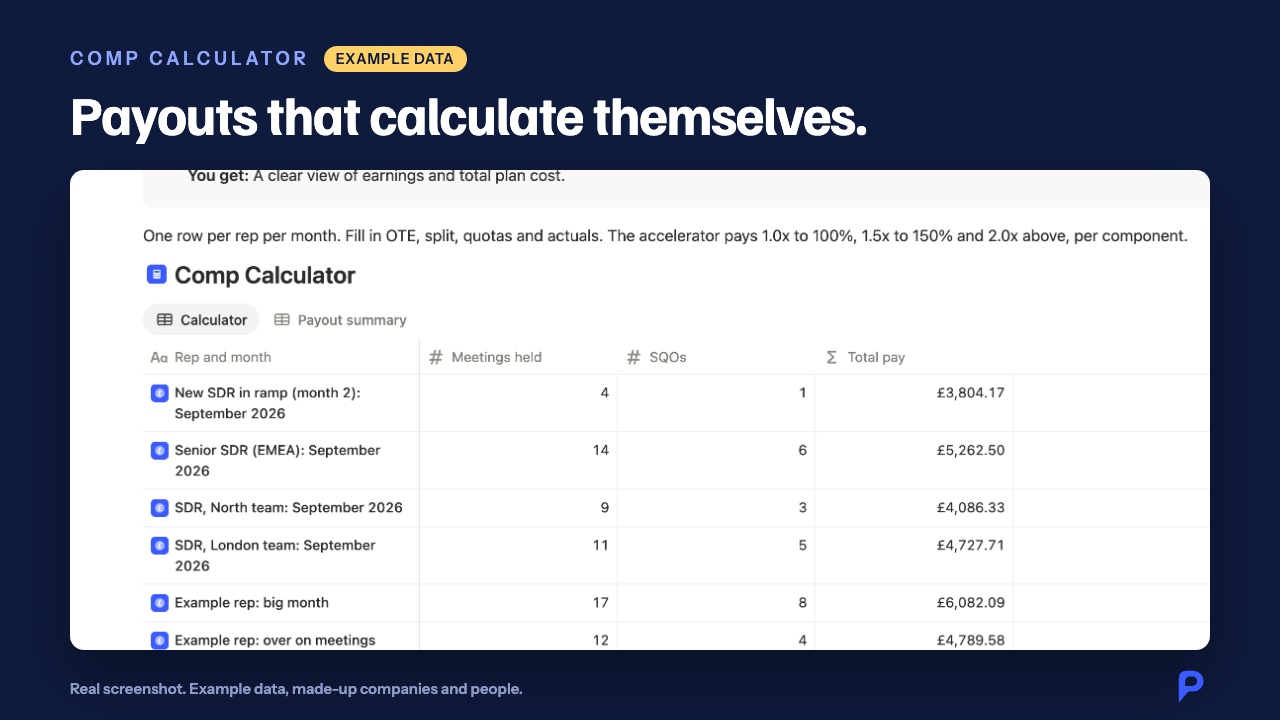
See inside
Activity totals as a sense check
The Bridge Group's 2025 SDR report found a median of 112 activities a day. The medians by channel were 44 phone, 41 email and 19 LinkedIn. It also found 4.1 quality conversations a day. If your reps are far below that on activity, look at tooling and admin time. Far above it with few conversations? Then the list or the message is the problem. Our SDR KPIs and benchmarks guide has the full set.
Worked example: building an outbound activity plan
Kestrel Payroll Cloud is an invented company. It wants each outbound SDR to hold 10 meetings a month. It uses the team's own rates from last quarter. Then it checks them against the benchmarks above.
| Step | Assumption (Kestrel's own data) | Result |
|---|---|---|
| Meetings held needed | Monthly quota | 10 |
| Meetings booked needed | 80% show rate | 12.5, round to 13 |
| Phone | 50 dials a day for 20 days; 8% connect; 10% of conversations book | 1,000 dials, 80 conversations, 8 meetings |
| 300 new prospects a month in a 5-step sequence; 3% reply; a third of replies book | 9 replies, 3 meetings | |
| Social | Own data: about 2 a month from connection messages | 2 meetings |
| Total | 13 booked meetings |
Now the sense check. Kestrel's 8% connect rate sits between Gong's 2024 average and top quartile. So it is believable. Its 3% email reply rate is above the 2.1% median in Visionary Marketing's 2026 study. Check that automated replies are excluded.
Next, test the sensitivity. Say Kestrel's connect rate fell to the 5.4% average. Phone would then produce about 5.4 meetings instead of 8. The plan would miss by nearly three meetings. Adding 25 dials a day would close the gap on paper. Better phone numbers and calling at the times that connect come first. Talk it through in the weekly 1:1 with the numbers in front of you.
Five outbound metrics to add to your dashboard
- Connect rate per prospect, as well as per dial. It shows whether reps give up too early.
- Positive reply rate. Count "remove me" replies separately.
- Time to first touch on a new account. It shows how long new accounts sit untouched.
- Sequence completion. Prospects dropped after step two never see the later steps.
- Meetings per 100 prospects, by channel. It tells you where to put next month's effort.
Put them on one screen. Our SDR KPI dashboard template guide shows a layout.
Want the metric definitions, activity plan and dashboard ready to use? The SDR Programme Playbook (£29 + VAT) is a Notion workspace you can duplicate and adapt.
Next steps: the dials per day calculator turns the call rates above into a daily goal. The free call review scorecard scores the calls themselves.
Sources
- Gong Labs, The hidden power of cold calling, 2024 (latest, checked 18 Oct 2026)
- Belkins, B2B cold calling statistics 2026: benchmarks from 175,000+ dials. 2025 data, published 26 June 2026
- Visionary Marketing, B2B cold email benchmarks study, April 2026
- lemlist, Cold email response rates: B2B benchmarks and data for 2026 (citing Woodpecker)
- The Bridge Group, SDR Models, Motions and Metrics, 2025 edition
Questions
What is a good cold call connect rate?
Gong Labs' 2024 data puts the average at 5.4% of dials. The top quartile reached 13.3%. Belkins' 2025 data found 9.9% per dial. In our view, a rate that stays above 10% points to good data and timing.
What is a good cold email reply rate?
Visionary Marketing's April 2026 study found a median of 2.1%. Woodpecker data cited by lemlist in 2026 puts the average at 3.43%. Sources count replies differently, so compare your team with its own history first.
How many dials does it take to book a meeting?
Belkins' 2025 data found about 370 dials per booked meeting. On Gong's 2024 rates, an average rep needs roughly 400. A top-quartile rep needs about 45 (our calculation).
How many activities should an outbound SDR do per day?
The Bridge Group's 2025 report found a median of 112 a day. That covers phone, email and LinkedIn. Use it as a sense check. Track conversations and meetings as your main numbers.
How many touches should an outbound sequence have?
Visionary Marketing's April 2026 study found five email steps over 14 to 21 days performed best. You can add calls and social touches alongside the emails.
Related guides
SDR and BDR KPIs
What to measure, and 2024-2025 benchmarks to sense-check against.
SDR KPI dashboard template
What to show on one screen, benchmarks and what to leave off.
Weekly SDR 1:1s
A 30-minute agenda, coaching questions and a worked example.
Follow up email after no response
Four templates with timing, ending in a clean exit.
SDR weekly report template
Six numbers on one page.
Turn this into a programme you can run
14 Notion modules and 6 working trackers for SDR leaders. KPI library, comp calculator, cadence builder, interview scorecard, tool scorecard and a 90-day roadmap. £29, one payment, plus VAT for UK and EU buyers.
Treat benchmarks as starting points. Tune them to your market, deal size and sales cycle. Every figure shows its source and year.