SDR KPI dashboard template: what it should show and what to leave off
A good SDR dashboard answers three questions in under a minute. Is the work happening? Is it working? Who needs help this week? Many dashboards show 30 tiles and answer none of them. Here's a one-screen layout, the metrics to put on it and what to leave off.
SDR (sales development representative) and BDR (business development representative) are the same job at most companies. Everything here applies to both.
Only need pay and outreach? The SDR Toolkit is £12.99 + VAT.Get the playbook
The one-screen layout
Three rows, read top to bottom. Outcomes first, because that's what the team is paid for.
| Row | What goes in it |
|---|---|
| 1. Outcomes | Meetings held, share accepted by AEs, opportunities created and pipeline sourced. Month to date against target |
| 2. Conversion | Connect rate, conversation-to-meeting rate, show rate and meeting-to-opportunity rate |
| 3. Activity and health | Quality conversations a day, activity by channel, attainment by rep and ramp status for new reps |
The middle row is where coaching starts. If outcomes are down and activity is fine, a conversion step has broken. The dashboard should show you which.
Show every number three ways: this period, the target and the same period last month. A number with no comparison can't tell you whether to act. Put new reps on their own line against their ramped quota. Then they neither drag the team average down nor hide inside it.
Benchmarks to sense-check against
Set targets from your own baseline first. These public figures are a sense check, mostly from US B2B software teams.
| Metric | Benchmark | Source |
|---|---|---|
| Meetings held per SDR per month | 10 median quota | Bridge Group, 2025 |
| Meetings that become opportunities | 6 a month median | Bridge Group, 2025 |
| Quality conversations per day | 4.1 | Bridge Group, 2025 |
| Connect rate per dial | 5.4% average, 13.3% top quartile | Gong Labs, 2024 |
| Meetings set per connected call | 4.6% average, 16.7% top quartile | Gong Labs, 2024 |
| Pipeline sourced per SDR per year | $3.78M median | Bridge Group, 2025 |
| Share of SDRs at quota | 60% | Bridge Group, 2025 |
| AE acceptance and show rate | No reliable public benchmark. Set your own |
Our SDR and BDR KPIs guide explains what each metric means and how to count it.
One dashboard, four views
| Viewer | What they need to see |
|---|---|
| SDR | Their own numbers against target this week, and today's next actions |
| SDR manager | Reps side by side, conversion at each step and who needs coaching |
| AE leaders | Meetings accepted and opportunities created, by SDR and by segment |
| Leadership | Pipeline sourced against plan, the spread of attainment and attrition |
Same data, different filters. Building four separate dashboards means four versions of the truth.
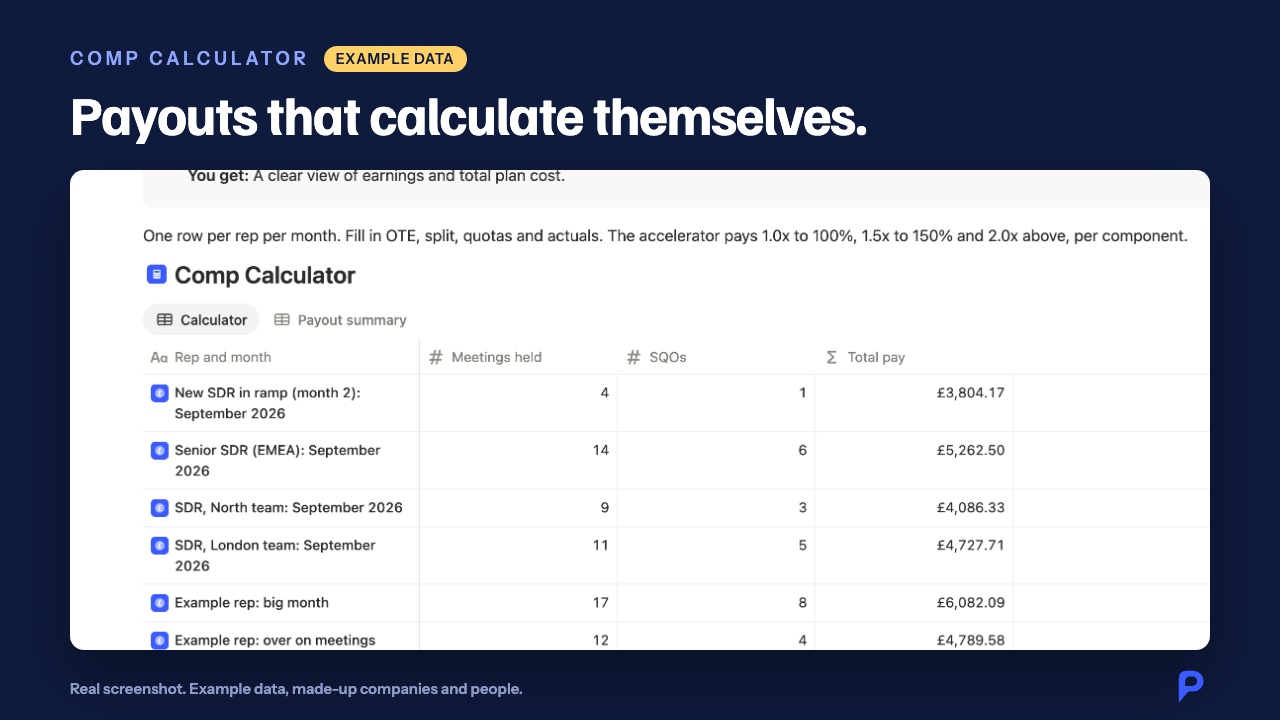
See inside
What to leave off
- Emails sent as a headline number. It's easy to inflate and says nothing about quality.
- Meetings booked but not yet held. Show them as upcoming, never as results.
- An activity-only leaderboard. It rewards volume over judgement. Rank on held and accepted meetings instead.
- Anything nobody acts on. If a tile hasn't changed a decision in a month, remove it.
Set it up in a week
- ☐ Write down what counts as "held" and "accepted"
- ☐ Add an AE acceptance field to the meeting record in the CRM
- ☐ Use one source of truth, not a spreadsheet beside the CRM
- ☐ Set targets from your own last three months, then sense-check against benchmarks
- ☐ Snapshot the numbers weekly so you can see trends
- ☐ Review it in the weekly team meeting, one row at a time
Sources
- The Bridge Group, SDR Models, Motions & Metrics 2025 Research Report
- Gong Labs, The hidden power of cold calling, 2024 (latest, checked 18 Oct 2026)
Questions
What should an SDR KPI dashboard show?
Outcomes first: meetings held, AE acceptance, opportunities and pipeline. Then the conversion rates between each step. Then activity, attainment by rep and ramp status. Keep it to one screen.
How often should SDR KPIs be reviewed?
Review leading indicators such as conversations and connect rate weekly, and coach on them. Review outcomes such as held meetings, opportunities and pipeline monthly against target.
Should an SDR dashboard show activity metrics?
Yes, for coaching, but not as the headline or as the basis for pay. Activity tells you whether the work is happening. Held and accepted meetings tell you whether it is working.
Also: SDR tech stack checklist, lead scoring template, SDR team meeting agenda, SDR playbook template for SaaS.
Related guides
SDR and BDR KPIs
What to measure, and 2024-2025 benchmarks to sense-check against.
Why SDR and BDR programmes fail
The usual causes, the warning signs and the order to fix them in.
SDR onboarding checklist
What to set up, teach and check in a new rep's first 90 days.
SDR meeting handoff notes
Seven fields an AE needs before accepting a meeting.
SDR weekly report template
Six numbers on one page.
Turn this into a programme you can run
Module 5 has a sample leadership dashboard, early warning signs and a KPI library. £29, one payment, plus VAT for UK and EU buyers.
Treat benchmarks as starting points. Tune them to your market, deal size and sales cycle. Every figure shows its source and year.